Voltammetric Investigation of the Reduction Processes of Nickel, Cobalt, and Iron
Ions in Chloride and Chloro-Fluoride Melts
J. Sytchev1, H. Kushkhov2
1
LIMOS Research Group, Department of Physical Chemistry,University of Miskolc, Miskolc-Egyetemváros, Hungary, 3515
2
Department of Inorganic and Physical Chemistry, Kabardino-Balkarian State University, 173, Chernyshevskogo str., Nalchik, Russia, 360004
Abstract
The electrochemical behaviour of Ni2+, Co2+ and Fe2+-ions has been studied in the NaCl-KCl-NiCl2(CoCl2, FeCl2) and NaCl-KCl-NaF(5 mol.%)-NiCl2(CoCl2, FeCl2) molten systems at 973 K by means of cyclic voltammetry at a glassy carbon cathode. Voltammograms taken in the systems containing either Ni2+, Co2+ or Fe2+-ions have similar shapes. The main difference between them is that the reduction potential of Ni2+-ions is 195-310 mV more positive than the reduction potential of Fe2+-ions, while nickel and cobalt ions are reduced at approximately the same potentials. It was shown that the reduction process of nickel ions is a one-stage quasi-reversible process in the whole range of the polarisation rates used (0.01 V/s – 0.5 V/s). However, the reduction of Co2+-ions is reversible at polarisation rates of up to 0.1 V/s, and at higher polarisation rates the process becomes quasi-reversible. The reduction process of iron ions is quasi-reversible at a polarisation rate of 0.5 V/s. The rates of the electrode processes are limited by the rate of diffusion at low polarisation rates, while at high polarisation rates the rates of the electrode processes are limited both by the rates of diffusion and charge transfer. In the case of iron reduction at low polarisation rates the rate of the electrode reaction is also influenced by the rate of a subsequent chemical reaction.
Keywords: molten chlorides, NiCl2, CoCl2, FeCl2, voltammetry, electrode kinetics
Pure nickel and cobalt are mostly produced by the electrolysis of aqueous solutions. This method can be applied for iron purification, as well. It might also be of some interest to obtain these metals in the form of compounds with other elements from the media of molten salts.
High-temperature electrochemical synthesis from molten salts is a very perspective way to produce compounds of high purity, including borides [1, 2]. But before the synthesis is performed, the electrochemical properties of pure components should be investigated. The electrochemical behaviour of nickel, cobalt and iron ions in chloride melts was thoroughly investigated in works [3-15].
In our opinion, alkali chloro-fluoride melts are most suitable to synthesise Ni(Co, Fe)/TiB2 composite coatings for the following reasons. One is that boron-containing ions (e.g. BF4-) are not stable enough in alkali chloride melts - it leads to boron losses during the electrodeposition. But alkali fluoride (e.g. FLINAK) and oxy-fluoride melts, where boron-containing ions have sufficient stability, are too aggressive to work with. Besides, as the rule they have higher melting points than alkali chloro-fluoride melts. However, there are no literature data on the reduction kinetics of nickel, cobalt and iron ions in chloro-fluoride melts.
The aim of this work is to determine the mechanism of the reduction processes of nickel, cobalt and iron ions in chloro-fluoride melts, which are used to obtain titanium diboride coatings. From theoretical point of view it is also interesting to compare kinetic parameters of the electrode reactions in chloride and chloro-fluoride melts.
The molten systems NaCl-KCl-NiCl2(CoCl2, FeCl2) and NaCl-KCl-NaF(5 mol.%)-NiCl2(CoCl2, FeCl2) were studied at 973 K, under pure dry argon atmosphere. Cyclic voltammetry was used as the main experimental technique. Single scan and cyclic voltammograms were taken at different scan rates from 0.01 V/s till 0.5 V/s using a EF435B potentiostat and EF2105 AD-DA converter with a supporting computer system. Experiments were performed in a hermetically closed cell. A glassy carbon crucible served as counter electrode and as container for the electrolyte. As reference and working electrodes glassy carbon rods were used. The following reagents were used for the preparation of the electrolyte: NaCl, KCl, NaF (REANAL, “pro analysis”). Nickel, cobalt and iron chlorides were obtained by drying the hydrates NiCl2· 6H2O, CoCl2· 6H2O and FeCl2· 4H2O (REANAL, SPECTRUM 3D, “pro analysis”) as described in [16, 17].
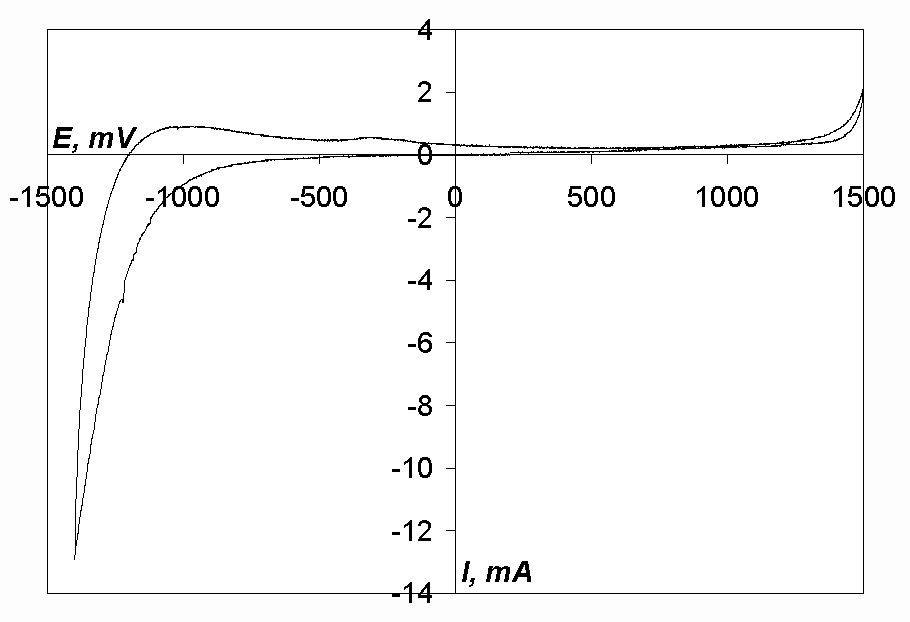
Cyclic voltammogram of the equimolar mixture of sodium and potassium chlorides, which was used as supporting electrolyte, is shown in Fig. 1. As can be seen, there are no waves or peaks in the range from –500 mV till +1250 mV (so-called, electrochemical window, i.e. the range of potentials where the substance or mixture of substances being investigated is stable). So we can state that the purity of the supporting electrolyte is satisfactory.
Figs. 2 and 3 show single scan voltammetric curves taken in the chloride melt at different concentrations of cobalt chloride (polarisation rate was kept constant) and at different scan rates (the concentration of cobalt chloride was kept constant), respectively. As can be seen, only one peak in the range –40-170 mV corresponding to the reduction process of cobalt ions is observed in the voltammograms. The height of the peak increases when the concentration of cobalt chloride and the scan rate are increasing, while the half-peak potential shifts to the anodic side as the concentration of cobalt chloride is increasing and to the cathodic side when the scan rate is increasing.
Single scan voltammograms of the NaCl-KCl-NaF-CoCl2 melt with gradually increasing concentration of sodium fluoride in it are shown in Fig. 4. One can see that the slope of the curve decreases and its half-peak potential shifts towards more negative values as the sodium fluoride concentration is increasing. In the case of the nickel- and iron-containing melts the slope of the curve changes in the same way as it does in the case of the cobalt-containing melt.
Cyclic voltammograms of the chloro-fluoride melt (5 mol.% of NaF) with additions of nickel, cobalt or iron chloride (curves 1, 2 and 3, respectively) are shown in Fig. 5. As can be seen, each of the voltammograms has one cathodic and one anodic peak. It should also be noted that the anodic peak is much higher than the cathodic peak in all three cases.
4. Discussion
Kinetic parameters of the reduction processes of nickel, cobalt and iron ions are presented in Tables 1 to 6. One can see that the reduction of iron ions (Tables 5, 6, Fig. 5) takes place at potentials, more negative by 195-310 mV than the reduction of nickel ions (Tables 1, 2, Fig. 5).
In works [12, 13] it was shown that nickel ions are reduced at a platinum cathode in chloride melts at potentials 200 mV more positive than cobalt ions. However, in our case (in the case of a glassy-carbon working electrode) the reduction processes of nickel and cobalt ions take place approximately at the same potentials. Probably, the reduction process of nickel ions proceeds with a higher overpotential than that of cobalt ions because the slope of the curves taken in nickel-containing melts is less than it is in the case of cobalt-containing melts (Tables 1, 2 and 3, 4 respectively, Fig. 5). Higher overpotential of an electrode process leads to a negative shift of the curve half-peak potential.
Nickel, cobalt and iron ions exist in chloride melts mainly in the form of tetrahedral complexes [MeCl4]2-, where Me – Ni, Co, Fe (however, existence of the complexes [CoCl3]-, [CoCl5]3-, [FeCl5]3- is also possible) [18-21]. We suppose that in the case of the chloro-fluoride melts chloride anions are partially substituted with fluoride ones:
[MeCln](n-2)- + xF- ® [MeCln-xFx](n-2)- + xCl-
where Me – Ni, Co, Fe.
The decrease in the slope of the single scan voltammetric curves when the concentration of sodium fluoride in the melt is increasing (Fig. 4) can be an evidence of the chemical reaction written above. This reaction is obviously due to the fact that the formation of chloro-fluoride and fluoride complexes is more profitable energetically than the formation of chloride complexes (the Gibbs energies of formation of nickel, cobalt and iron fluorides are approximately 350 kJ/mol more negative than the energies of the chlorides formation [22]).
Fig. 1. Cyclic voltammogram of the melt NaCl-KCl. T= 973 K, Cathode-glassy carbon,
Acath. = 0.18 cm2, v= 0.1 V/s
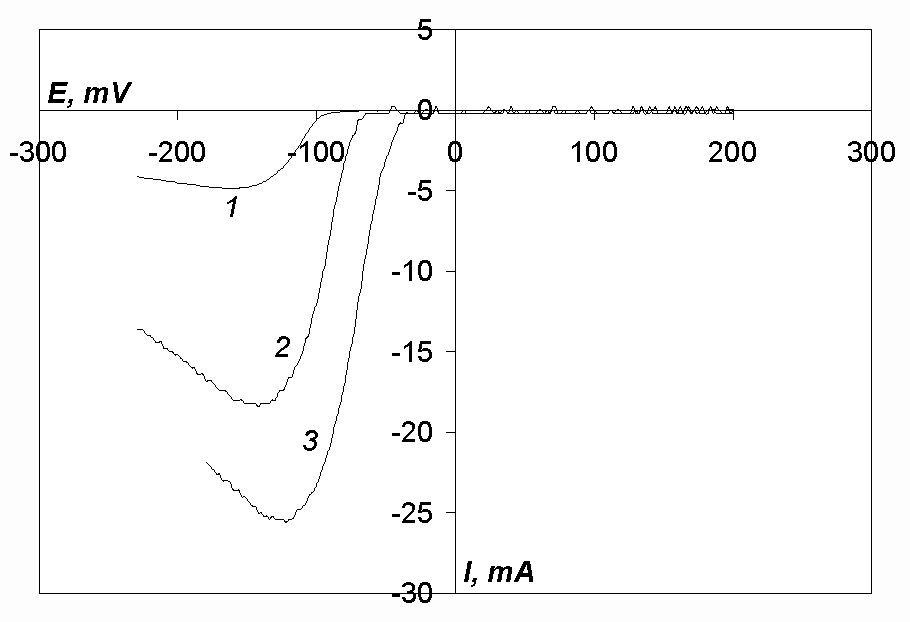
Fig. 2. Single scan voltammograms of the melt NaCl-KCl-CoCl2. c(CoCl2)· 10-5, mol/cm3: 2.27 (curve 1), 8.28 (curve 2), 11.70 (curve 3). T= 973 K, Cathode-glassy carbon, Acath. = 0.18 cm2, v= 0.2 V/s
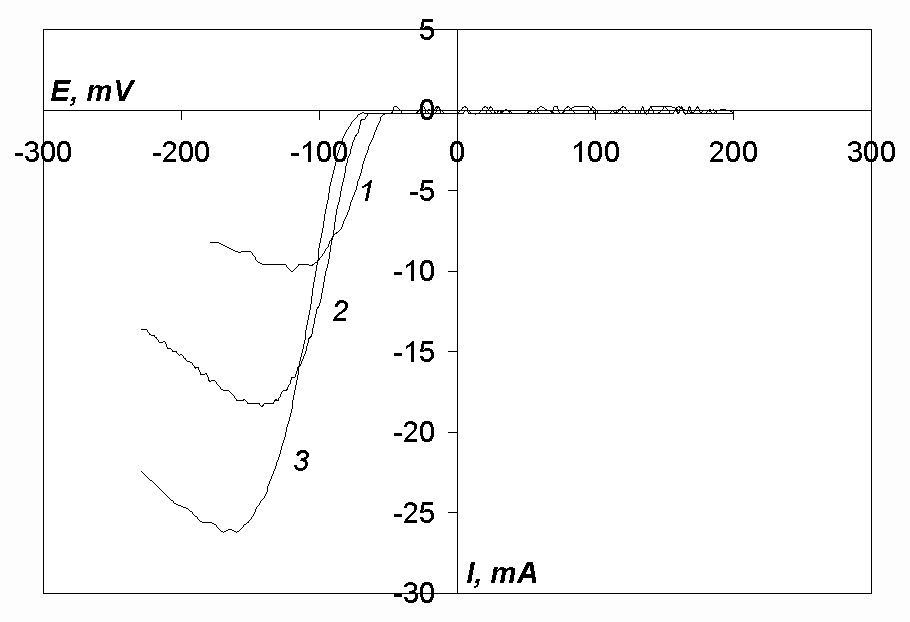
Fig. 3. Single scan voltammograms of the melt NaCl-KCl-CoCl2. c(CoCl2)= 8.28· 10-5 mol/cm3. T= 973 K, Cathode-glassy carbon, Acath. = 0.18 cm2, v, V/s: 0.05 (curve 1), 0.2 (curve 2), 0.5 (curve 3)
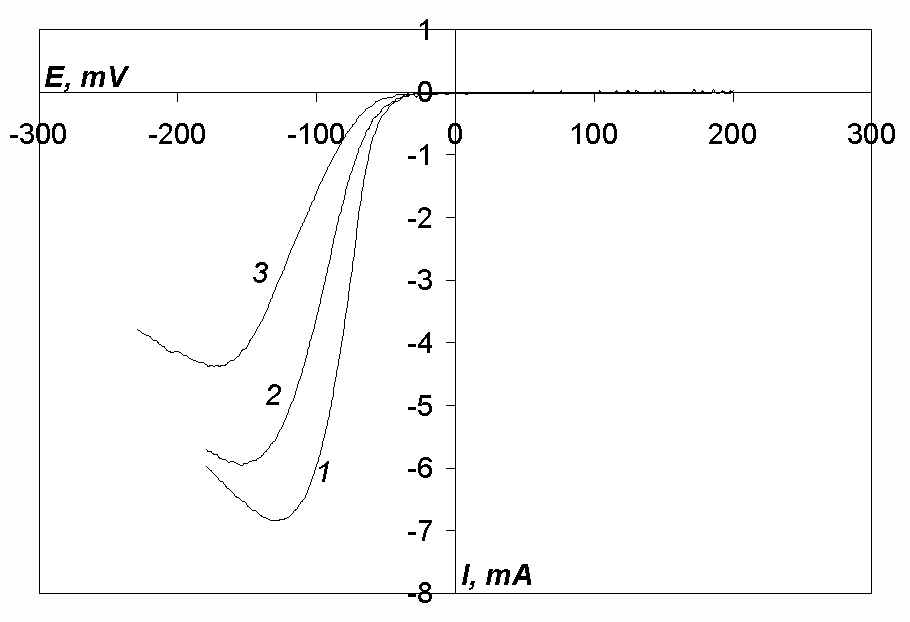
Fig.4. Single scan voltammograms of the melt NaCl-KCl-NaF-CoCl2. c(CoCl2)= 4.28· 10-5 mol/cm3, c(NaF)· 10-5, mol/cm3: 0 (curve 1), 4.28 (curve 2), 21.40 (curve 3). T= 973 K, Cathode-glassy carbon,
Acath. = 0.15 cm2, v= 0.2 V/s
Fig.5. Cyclic voltammograms of the melt NaCl-KCl-NaF(5 mol.%)-MeCl2, where Me – Ni (curve 1, c(NiCl2)= 9.81· 10-5 mol/cm3, Acath. = 0.081 cm2), Co (curve 2, c(CoCl2)= 9· 10-5 mol/cm3, Acath. = 0.11 cm2), Fe (curve 3, c(FeCl2)= 9.81· 10-5 mol/cm3, Acath. = 0.087 cm2). T= 973 K, Cathode-glassy carbon, v= 0.2 V/s
If the electrode process is reversible, the following equations can be written, linking the peak width or the difference between cathodic and anodic peak potentials in a voltammogram with the number of electrons participating in an act of charge-transfer [23, 24]:
![]()
![]()
![]()
![]()
where Epc – the potential of a cathodic peak in a voltammogram,
Epa – the potential of an anodic peak,
Ep/2c – the cathodic half-peak potential,
n – the number of electrons taking part in an act of charge transfer.
Equation (1) is universal for all kinds of reversible electrode processes and equation (2) is used for a reversible cathodic process with the formation of an insoluble product.
Taking into consideration possible oxidation states of nickel, cobalt and iron and the shape of the voltammograms we suppose that two electrons are involved in the elementary acts of the reduction processes of nickel, cobalt and iron ions. Hence, in the case of a reversible two-electron process at 973 K the difference Epc - Epa should be 92 mV (equation 1).
According to phase diagrams [25] there are no stable carbide phases at the temperature of experiment in any of the systems: Ni-C, Co-C or Fe-C. On the other hand, neither nickel nor cobalt is soluble in the melt. All this makes nickel, cobalt (and partly iron) deposited accumulate on the electrode surface, and this leads to the sharp increase of the current in the anodic cycle of polarisation.
Therefore, using equation (2) it can be found that the difference Ep/2c - Epc for a reversible two-electron cathodic process with the formation of an insoluble product must be equal to 32 mV.
As one can see from Tables 3 and 4, the difference between the cathodic peak and half-peak potentials (Ep/2c - Epc) in the case of cobalt reduction is 32-36 mV for a scan rate of 0.1 V/s, which is in a good agreement with the assumption made above. However, this difference has got much higher values for the reduction of nickel and iron ions (Tables 1, 2 and 5, 6, respectively), which can be referred to the slow charge transfer stage. The slow rate of the charge transfer stage is one of possible explanations of the fact that the difference between the cathodic and anodic peak potentials (Epc - Epa) is considerably higher than the theoretical value for a reversible two-electron process (92 mV) in all the cases (nickel, cobalt or iron reduction, in the both melts). The ohmic drop effect due to possible oxidation of the metal layer can also influence the value of Epc - Epa [23].
In order to estimate the characters of the electrode processes, the dependences Ipc/v1/2 – v1/2 (Fig. 6) and Ipc – c(MeCl2) (Fig. 7), where Me – Ni, Co, Fe, have been analysed. The view of the dependence Ipc/v1/2 – v1/2 for Ni, Co and Fe-reduction processes and of the dependence Ipc – c(MeCl2) for the Ni and Co is the same both in the chloride and chloro-fluoride melts. The view of the dependence Ipc – c(FeCl2) (Fig. 8) is slightly different; this question is discussed in details below.
Based on this analysis we can conclude that the cathodic processes in the case of nickel and cobalt ions have got a diffusion-rate-controlled character both in the chloride and chloro-fluoride melts at all the polarisation rates, as the peak current is proportional to the depolarizer concentration in the melt. This fact is also supported by the values jdc/nFC which are of 10-3 cm/s order of magnitude for the reduction processes of Ni and Co-ions (Tables 1-4), which is characteristic for diffusion-rate-controlled processes.
The rate of charge transfer also influences the rate of the electrode reaction at high scan rates in all the melts studied, because the curves Ipc/v1/2 – v1/2 approach horizontal lines as the polarisation rate is increasing (Fig. 6). This conclusion is in agreement with the fact that the half-peak potential of the voltammograms shifts towards more negative values when the polarisation rate is increasing (Tables 1-6, Fig. 3).
In the case of the iron-containing melts the values jdc/nFC for iron reduction are lower (Tables 5, 6) than for the reduction processes of nickel and cobalt ions, and the dependences Ipc - c(FeCl2) are not extrapolated to zero current when the iron dichloride concentration is equal to zero (Fig. 8).
According to the results of works [26-28], molten iron dichloride dissolves iron metal in accordance with the following chemical reaction:
Fe + FeCl2 « 2FeCl (4)
In case when an alkali chloride melt containing iron divalent ions is in contact with iron metal, reaction (4) can also take place [3]. Hence, iron metal being deposited onto the electrode surface during the cathodic cycle, interacts with iron dichloride and decreases its concentration in the melt. This process takes place inevitably, as the initial FeCl concentration in the melt is zero, and therefore the initial driving force of reaction (4) is infinitely large. And this results in the cathodic peak current decrease. It may be possible explanation of the facts on the jdc/nFC values and Ipc - c(FeCl2) dependences (see Fig. 8).
It should also be noted that the higher is the polarisation rate, the less the deviation of the dependence Ipc - c(FeCl2) from zero current at zero concentration of iron dichloride is. So it means that reaction (4) is a relatively slow process.
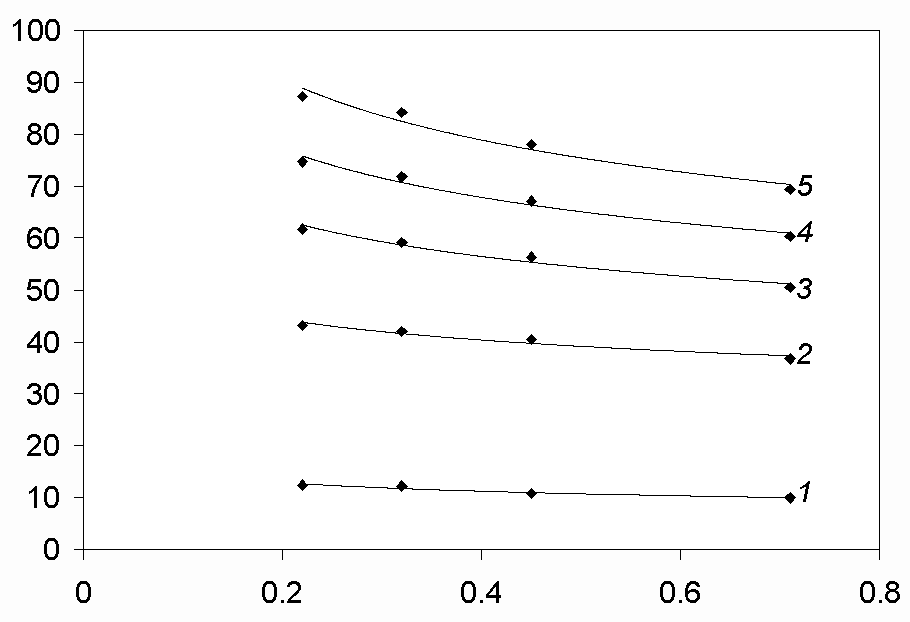
Fig.6. Dependence Ipc/v1/2 - v1/2 at different concentrations of CoCl2 in the NaCl-KCl-CoCl2 melt. T= 973 K, Cathode-glassy carbon, Acath. = 0.18 cm2, c(CoCl2)· 10-5, mol/cm3: 2.27 (curve 1), 8.28 (curve 2), 11.70 (curve 3), 14.20 (curve 4), 16.70 (curve5)
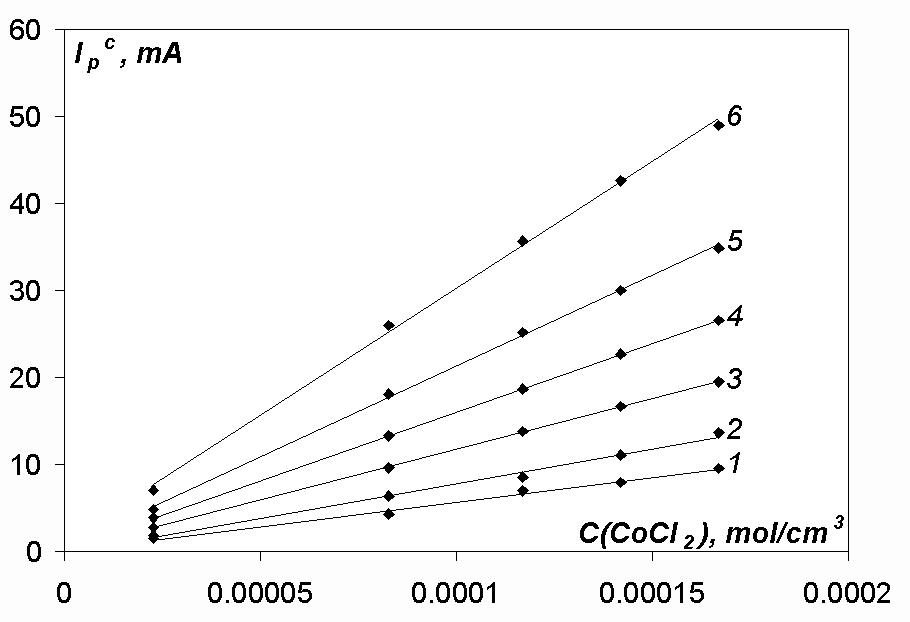
Fig.7. Dependence Ipc-c(CoCl2) at different polarisation rates in the NaCl-KCl-CoCl2 melt. T= 973 K, Cathode-glassy carbon, Acath. = 0.18 cm2, v, V/s: 0.01 (line 1), 0.02 (line 2), 0.05 (line 3), 0.1 (line 4), 0.2 (line 5), 0.5 (line 6)
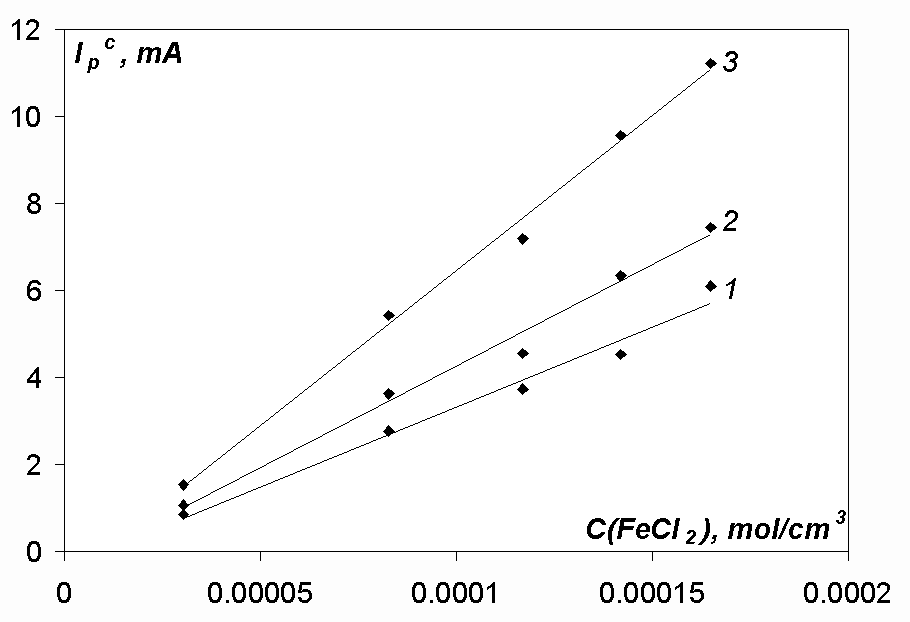
Fig.8. Dependence Ipc-c(FeCl2) at different polarisation rates in the NaCl-KCl-FeCl2 melt. T= 973 K, Cathode-glassy carbon, Acath. = 0.17 cm2, v, V/s: 0.01 (line 1), 0.02 (line 2), 0.05 (line 3)
Conclusions
References
Table 1. Kinetic parameters of the reduction process of Ni2+-ions in the NaCl-KCl-NaF(5 mol.%)-NiCl2 melt. T= 973 K, Cathode-glassy carbon, Acath. = 0.081 cm2
|
c(NiCl2), mol/cm3 |
v, V/s |
Ipc(Idc*), mA |
jpc(jdc*), mA/cm2 |
-Epc, V |
-Ep/2c, V |
Epa, V |
jdc/nFC, cm/s |
|
3.8· 10-5 |
0.1 0.2 0.5 |
2.11 2.68 3.82 |
26.05 33.09 47.16 |
- 0.160 0.160 |
0.058 0.098 0.113 |
0.080 0.076 0.085 |
- - - |
|
5.89· 10-5 |
0.01 0.1 0.2 0.5 |
2.36 3.10 3.61 5.30 |
29.14 38.27 44.57 65.43 |
- 0.142 0.160 0.165 |
0.062 0.074 0.095 0.115 |
0.070 0.071 0.072 0.085 |
2.56· 10-3 - - - |
|
9.81· 10-5 |
0.1 0.2 0.5 |
4.41 5.93 9.22 |
54.44 73.21 113.83 |
- 0.164 0.165 |
0.071 0.094 0.117 |
0.071 0.078 0.090 |
- - - |
Table 2. Kinetic parameters of the reduction process of Ni2+-ions in the NaCl-KCl-NiCl2 melt. T= 973 K, Cathode-glassy carbon, Acath. = 0.27 cm2
|
c(NiCl2), mol/cm3 |
v, V/s |
Ipc(Idc*), mA |
jpc(jdc*), mА/cm2 |
-Epc, V |
-Ep/2c, V |
Epa, V |
jdc/nFC, cm/s |
|
8.28· 10-5 |
0.01 0.2 0.5 |
9.70 22.50 33.10 |
35.93 83.33 122.59 |
- 0.182 0.180 |
0.064 0.111 0.104 |
0.052 0.056 0.085 |
2.25· 10-3 - - |
|
1.17· 10-4 |
0.01 0.1 0.2 0.5 |
13.60 24.30 30.90 44.80 |
50.37 90.00 114.44 165.93 |
- 0.159 0.160 0.170 |
0.054 0.098 0.096 0.101 |
0.072 0.071 0.092 0.110 |
2.23· 10-3 - - - |
|
1.42· 10-4 |
0.01 0.1 0.2 0.5 |
15.90 27.70 35.60 50.40 |
58.89 102.59 131.85 186.67 |
- 0.146 0.156 0.175 |
0.047 0.086 0.092 0.105 |
0.082 0.090 0.110 0.130 |
2.15· 10-3 - - - |
Table 3. Kinetic parameters of the reduction process of Co2+-ions in the NaCl-KCl-NaF(5 mol.%)-CoCl2 melt. T= 973 K, Cathode-glassy carbon, Acath. = 0.11 cm2
|
c(CoCl2), mol/cm3 |
v, V/s |
Ipc(Idc*), mA |
jpc(jdc*), mA/cm2 |
-Epc, V |
-Ep/2c, V |
Epa, V |
jdc/nFC, cm/s |
|
3· 10-5 |
0.01 0.1 0.2 0.5 |
1.37 3.35 4.47 6.52 |
12.45 30.45 40.64 59.27 |
- 0.096 0.110 0.215 |
0.060 0.063 0.074 0.142 |
0.056 0.058 0.068 0.080 |
2.15· 10-3 - - - |
|
7· 10-5 |
0.01 0.1 0.2 0.5 |
3.66 8.54 11.31 14.14 |
33.27 77.64 102.82 128.55 |
- 0.095 0.110 0.190 |
0.060 0.059 0.071 0.091 |
0.056 0.065 0.080 0.115 |
2.46· 10-3 - - - |
|
9· 10-5 |
0.01 0.1 0.2 0.5 |
4.07 10.91 14.17 18.08 |
37.00 99.18 128.82 164.36 |
- 0.097 0.120 0.180 |
0.050 0.062 0.075 0.096 |
0.056 0.068 0.086 0.130 |
2.13· 10-3 - - - |
Table 4. Kinetic parameters of the reduction process of Co2+-ions in the NaCl-KCl-CoCl2 melt. T= 973 K, Cathode-glassy carbon, Acath. = 0.18 cm2
|
c(CoCl2), mol/cm3 |
v, V/s |
Ipc(Idc*), mA |
jpc(jdc*), mA/cm2 |
-Epc, V |
-Ep/2c, V |
Epa, V |
jdc/nFC, cm/s |
|
2.27· 10-5 |
0.01 0.1 0.2 0.5 |
1.50 3.88 4.84 7.08 |
8.33 21.56 26.89 39.33 |
- 0.130 0.164 0.255 |
0.079 0.098 0.115 0.165 |
0.030 0.029 0.036 0.045 |
1.90· 10-3 - - - |
|
8.28· 10-5 |
0.01 0.2 0.5 |
4.32 18.10 26.00 |
24.00 100.56 144.44 |
- 0.142 0.160 |
0.063 0.094 0.109 |
0.022 0.058 0.075 |
1.50· 10-3 - - |
|
1.17· 10-4 |
0.01 0.2 0.5 |
6.98 25.20 35.70 |
38.78 140.00 198.33 |
- 0.122 0.155 |
0.071 0.072 0.091 |
0.009 0.090 0.110 |
1.72· 10-3 - - |
Table 5. Kinetic parameters of the reduction process of Fe2+-ions in the NaCl-KCl-NaF(5 mol.%)-FeCl2 melt. T= 973 K, Cathode-glassy carbon, Acath. = 0.087 cm2
|
c(FeCl2), mol/cm3 |
v, V/s |
Ipc(Idc*), mA |
jpc(jdc*), mA/cm2 |
-Epc, V |
-Ep/2c, V |
-Epa, V |
jdc/nFC, cm/s |
|
2.27· 10-5 |
0.1 0.2 0.5 |
0.32 0.45 0.76 |
3.68 5.17 8.74 |
0.373 0.398 0.425 |
0.293 0.325 0.360 |
0.138 0.134 0.130 |
- - - |
|
5.89· 10-5 |
0.01 0.1 0.5 |
0.70 0.91 1.67 |
8.05 10.46 19.20 |
- 0.438 0.445 |
0.256 0.362 0.387 |
0.110 0.162 0.165 |
7.06· 10-4 - - |
|
9.81· 10-5 |
0.1 0.2 0.5 |
1.83 2.23 3.07 |
21.03 25.63 35.29 |
0.417 0.432 0.450 |
0.368 0.380 0.403 |
0.176 0.164 0.155 |
- - - |
Table 6. Kinetic parameters of the reduction process of Fe2+-ions in the NaCl-KCl-FeCl2 melt. T= 973 K, Cathode-glassy carbon, Acath. = 0.17 cm2
|
c(FeCl2), mol/cm3 |
v, V/s |
Ipc(Idc*), mA |
jpc(jdc*), mA/cm2 |
-Epc, V |
-Ep/2c, V |
-Epa, V |
jdc/nFC, cm/s |
|
3.03· 10-5 |
0.01 0.1 0.2 0.5 |
0.86 2.12 3.07 4.97 |
5.06 12.47 18.06 29.24 |
0.359 0.408 0.444 0.475 |
0.329 0.352 0.378 0.416 |
0.233 0.216 0.214 0.210 |
8.65· 10-4 - - - |
|
8.28· 10-5 |
0.01 0.1 0.2 0.5 |
2.77 7.16 9.62 15.49 |
16.29 42.12 56.59 91.12 |
- 0.349 0.378 0.410 |
0.276 0.305 0.320 0.357 |
0.184 0.173 0.164 0.145 |
1.02· 10-3 - - - |
|
1.17· 10-4 |
0.01 0.1 0.2 0.5 |
3.74 9.76 13.70 21.50 |
22.00 57.41 80.59 126.47 |
- 0.394 0.402 0.440 |
0.289 0.333 0.353 0.381 |
0.190 0.176 0.168 0.150 |
9.74· 10-4 - - - |
* At a polarisation rate of 0.01 V/s