|
1. Introduction
Dense silicon nitride ceramics are important structural materials because of their good room- and high-temperature mechanical properties. Silicon nitride ceramics of low porosity are usually densified by liquid-phase sintering [1]. Consequently, the average particle size and the particle size distribution have a great influence on the density, the phase composition and the microstructure, and therefore on the mechanical properties of the resulting ceramics [2-4]. Cambier et al. have found that the density of the specimen at the beginning of sintering is larger if the particle size distribution of the starting powder is wider [4]. It has been also established that during sintering the densification depends mainly on the inverse of the average particle size. On the other hand, if the particle size distribution at the beginning is wide then coarsening of the particles can occur leading to lower sinterability as densification proceeds [4].
X-ray diffraction is an effective tool for the determination of crystallite size distribution. X-ray diffraction line profiles are broadened due to the smallness of crystallites and the lattice distortions. The two effects can be separated on the basis of the different diffraction order dependence of peak broadening. The standard methods of X-ray diffraction profile analysis - based on the full widths at half maximum (FWHM), the integral breadths and on the Fourier coefficients of the profiles - provide the apparent crystallite size and the mean square strain [5-7]. At the same time it has been shown in a lot of papers [see, e.g. Refs. 8 and 9] that the shape of the diffraction profiles depends not only on the mean size but also on the size-distribution and the shape of crystallites. If the shape of the crystallites can be assumed to be uniform, the area- and the volume-weighted mean crystallite sizes can be determined from the Fourier coefficients and the integral breadths of the X-ray diffraction profiles [8-12]. These two mean sizes of crystallites can be used for the determination of a crystallite size distribution function having two free parameters. There is a large amount of experimental evidence that in nanocrystalline materials the crystallite-size distribution is usually log-normal [8,9,12,13]. Hinds [14] proposed formulas to calculate the two characteristic parameters of the log-normal size distribution function from the area- and the volume-weighted means. Krill & Birringer [9] determined the weighted mean crystallite sizes from the Fourier transform of X-ray diffraction profiles. Using the formulas of Hinds [14] they calculated the parameters of the log-normal size distribution for nanocrystalline palladium. Langford and coworkers [8] have elaborated a whole powder pattern fitting procedure to determine the crystallite size distribution in the absence of strain.
The evaluation of the X-ray profiles is further complicated by the anisotropic strain broadening of the diffraction lines. This means that neither the full width at half maximum nor the integral breadth nor the Fourier coefficients of the profiles are monotonous functions of the diffraction vector [15-17]. It has been shown recently that the strain anisotropy can be well accounted for by the dislocation model of the mean square strain by introducing the contrast factors of dislocations [18-23].
An evaluation procedure of X-ray diffraction profiles has been elaborated recently for the determination of crystallite size distribution and the dislocation density in nanocrystalline materials. This method was initiated and worked out by Ungár and his coworkers [24-27]. In this procedure the Fourier coefficients of the measured physical profiles are fitted by the Fourier coefficients of well established ab initio functions of size and strain peak profiles.
The aim of the present paper is to compare the crystallite size distribution and the dislocation density determined by X-ray peak profile analysis in two silicon nitride powders produced by essentially different methods of synthesis. The first sample was synthesized by vapor-phase reaction of silicon tetrachloride and ammonia in thermal plasma, while the second one was made by the nitridation of silicon and subsequent milling. The area-weighted average crystallite size obtained by X-rays was compared to the area-weighted average particle size calculated from the specific surface area and with transmission electronmicroscopy (TEM) observations.
2. Experimental details
2.1. Powder preparation
Two kinds of silicon nitride powders were investigated. The first one (SN1500) was a laboratory produced powder synthesized by the vapor-phase reaction of silicon tetrachloride and ammonia in a radiofrequency thermal plasma reactor under conditions given previously [28,29]. The as-synthesized powder was subjected to a two-step thermal processing to remove NH4Cl and Si(NH)2 by-products formed due to the NH3 excess in the plasma synthesis. The powder was treated in nitrogen at 400°
C for 1 h and subsequently at 1100°
C for 1 h to achieve the complete decomposition of by-products. This resulting powder was predominantly amorphous with a crystalline content of about 20vol.%. The crystallization procedure was performed in a horizontal laboratory furnace in flowing nitrogen at 0.1 MPa, at annealing temperature of 1500°
C for 2 h. After crystallization the crystalline content of the powder was about 80vol.%. The second powder (LC12) was a commercial one produced by nitridation of silicon and post-milling (Starck Ltd., Germany).
2.2. X-ray diffraction technique
The crystalline phases were identified by X-ray diffraction (XRD) using a Guinier-Hagg focusing camera and CuKa
1 radiation. The relative amounts of a
- and b
-Si3N4 phases were determined from the XRD pattern using the Gazzara and Messier method [30]. In this procedure the intensities of the 201, 102 and 210 reflections of a
-Si3N4 and the 200, 101 and 210 reflections of b
-Si3N4 were averaged to minimize preferred orientation effects and statistical errors. The ratio of the amounts of a
- and b
-Si3N4 phases was calculated from these averaged intensities using the formula proposed by Camuscu et al. [31].
The diffraction profiles were measured by a special double crystal diffractometer with negligible instrumental broadening [22,32]. A fine focus rotating cobalt anode (Nonius FR 591) was operated as a line focus at 36 kV and 50 mA (l
=0.1789 nm). The symmetrical 220 reflection of a Ge monochromator was used in order to have wavelength compensation at the position of the detector. The Ka
2 component of the Co radiation was eliminated by an 0.16 mm slit between the source and the Ge crystal. The profiles were registered by a linear position sensitive gas flow detector, OED 50 Braun, Munich. In order to avoid air scattering and absorption the distance between the specimen and the detector was overbridged by an evacuated tube closed by mylar windows.
2.4. Transmission electron microscopy and the measurement of specific surface area
Transmission electron microscopy (TEM, JEOL JEM200CX) has been used for direct characterization of the size of crystallites. The specific surface area of the silicon nitride ceramic powder was determined from the oxygen adsorption isotherms by the BET (Brunauer-Emmett-Teller) method [33]. Assuming that the particles have spherical shape, the area-weighted average particle size (t) in nanometer was calculated as t=6000/qS where q is the density in g/cm3 and S is the specific surface area in m2/g.
3. Evaluation of the X-ray diffraction profiles
The crystallite size distribution and the dislocation density of the silicon nitride powders are determined by the recently developed method of X-ray diffraction peak profile analysis [26,27], therefore a brief description of this procedure is presented here. According to the kinematical theory of X-ray diffraction, the physical profile of a Bragg reflection is given by the convolution of the size and the distortion profiles [7]
IP=IS*ID, (1)
where the superscripts S and D stand for size and distortion, respectively. The Fourier transform of this equation gives [7]
A(L) = AS(L) AD(L),
(2)
where A(L) are the absolute values of the Fourier coefficients of the physical profiles, AS and AD are the size and the distortion Fourier coefficients and L is the Fourier variable.
Assuming that the lattice distortions are caused by dislocations in the crystal, the Fourier coefficients of the strain profile can be given as [7,18-20]
ADg (L) = exp(- r
BL2 f(h) K2 ) ,
(3) ) ,
(3)
where K=2sinq/l, q is the angle of diffraction at the exact Bragg position, l
is the wavelength of X-rays,  is the dislocation contrast factor, r
is the dislocation density, B=p
b2/2, where b is the Burgers vector of dislocations, h~
L/Re, where Re is the effective outer cut-off radius of dislocations and f(h) is a function derived explicitely by Wilkens [20]. The explicite form of f(h) can be found in equations A.6 to A.8 in Ref. 20. The asymptotic behaviour of f(h) is: is the dislocation contrast factor, r
is the dislocation density, B=p
b2/2, where b is the Burgers vector of dislocations, h~
L/Re, where Re is the effective outer cut-off radius of dislocations and f(h) is a function derived explicitely by Wilkens [20]. The explicite form of f(h) can be found in equations A.6 to A.8 in Ref. 20. The asymptotic behaviour of f(h) is:
f(h) ~
- lnh , if h<1
(4)
and
f(h)~
 , if h>1 .
(5) , if h>1 .
(5)
Instead of Re, it is physically more appropriate to use the dimensionless parameter M= Re defined by Wilkens as the dislocation arrangement parameter [20]. The value of M gives the strength of the dipole character of dislocations: the higher the value of M, the weaker the dipole character and the screening of the displacement fields of dislocations [20]. defined by Wilkens as the dislocation arrangement parameter [20]. The value of M gives the strength of the dipole character of dislocations: the higher the value of M, the weaker the dipole character and the screening of the displacement fields of dislocations [20].
The average dislocation contrast factors are the weighted average of the individual C factors either over the dislocation population or over the permutations of the hkl indices [34-36]. Based on the theory of line broadening caused by dislocations, it can be shown that in an untextured hexagonal polycrystalline specimen the values of  are simple functions of the invariants of the fourth order polynomials of hkl [36] are simple functions of the invariants of the fourth order polynomials of hkl [36]
 = =   , (6) , (6)
where  is the average dislocation contrast factor for the hk0 reflections, A and B are parameters depending on the elastic constants and on the character of dislocations in the crystal and a/c is the ratio of the two lattice constants of the hexagonal crystal. is the average dislocation contrast factor for the hk0 reflections, A and B are parameters depending on the elastic constants and on the character of dislocations in the crystal and a/c is the ratio of the two lattice constants of the hexagonal crystal.
It was observed by many authors that in powder or bulk nanocrystalline specimens the crystallite-size distribution density can be described by log-normal function [8,9,12,13,24]
f(x) =  (7)
(7)
where x is the crystallite size, s
is the lognormal variance and m is the median of the size distribution density function, f(x). For spherical crystallites with log-normal size distribution, the area-, volume- and arithmetically weighted mean crystallite sizes are obtained as [8]
<
x>
area=m exp(2.5 s
2) (8)
<
x>
vol=m exp(3.5 s
2) (9)
<
x>
arithm=m exp(0.5 s
2) (10)
Assuming spherical crystallite shape with log-normal size distribution, the Fourier transform of the size profile can be given as:
AS(L)~

. (11)
where erfc is the complementary error function.
A numerical procedure has been worked out for fitting the Fourier transform of the experimental profiles by the product of the theoretical functions of size and strain Fourier transforms given in equations (3) and (11) [26,27]. The method has the following steps: i) the Fourier coefficients of the measured physical profiles are calculated by a non-equidistant sampling Fourier transformation, ii) the Fourier coefficients of the size and strain profiles are calculated by using eqs. (3-6) and (11), (iii) the experimental and the calculated Fourier coefficients are compared by the least squares method. The two lattice parameters of the hexagonal crystal (a and c), the values of the length of the Burgers vector, b, and the contrast factor  are input parameters of the method. The procedure has six fitting parameters for hexagonal crystals: (i) m and (ii) s of the log-normal size distribution function (assuming spherical crystallites), (iii) r and (iv) M in the strain profile and (v)-(vi) A and B for the average dislocation contrast factors. Further details of the fitting procedure are given elsewhere [27]. are input parameters of the method. The procedure has six fitting parameters for hexagonal crystals: (i) m and (ii) s of the log-normal size distribution function (assuming spherical crystallites), (iii) r and (iv) M in the strain profile and (v)-(vi) A and B for the average dislocation contrast factors. Further details of the fitting procedure are given elsewhere [27].
4. Results and discussion
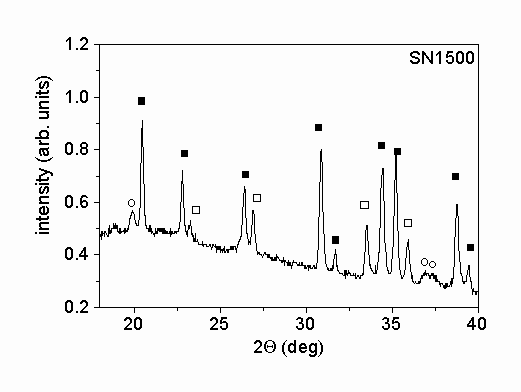
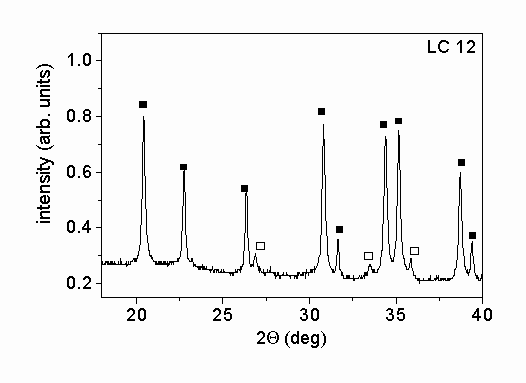
Fig. 1. shows characteristic parts of the X-ray diffractograms of the two different powders. The X-ray phase analysis shows that in both powders the main phase is a
-Si3N4. Beside this phase b
-Si3N4 was also identified in the powders. The mass ratios of a
- to b
-Si3N4 were 5.1 and 13.4 for samples SN1500 and LC12, respectively. A small amount of Si2N2O was also found in powder SN1500. The X-ray peak profile analysis was carried out only for the main a
-Si3N4 phase. The microstructural parameters obtained for this phase were taken as the characteristic parameters for the entire powder.
1.a.
1.b.
Figure 1.: X-ray diffractograms of the powders produced (a) by vapor-phase synthesis in thermal plasma followed by crystallization (SN1500) and (b) by silicon nitridation and post-milling (LC12). The solid and the open squares and the open circles represent a
-Si3N4, b
-Si3N4 and Si2N2O phases, respectively.
Before starting the fitting procedure the values of the lattice parameters, the length of the Burgers vector and  have to be specified. The lattice parameters of the hexagonal a
-Si3N4 are: a=0.782 nm and c=0.559 nm [37]. The value of have to be specified. The lattice parameters of the hexagonal a
-Si3N4 are: a=0.782 nm and c=0.559 nm [37]. The value of  was calculated numerically assuming elastic isotropy since, to the best knowledge of the authors, the anisotropic elastic constants of this material are not available. The isotropic was calculated numerically assuming elastic isotropy since, to the best knowledge of the authors, the anisotropic elastic constants of this material are not available. The isotropic  factor was evaluated for the most commonly observed dislocation slip system in silicon nitride [37]: <
0001>
{
10 factor was evaluated for the most commonly observed dislocation slip system in silicon nitride [37]: <
0001>
{
10 0}. Taking 0.24 as the value of the Poisson’s ratio [38], 0}. Taking 0.24 as the value of the Poisson’s ratio [38],  =0.0279 was obtained. =0.0279 was obtained.
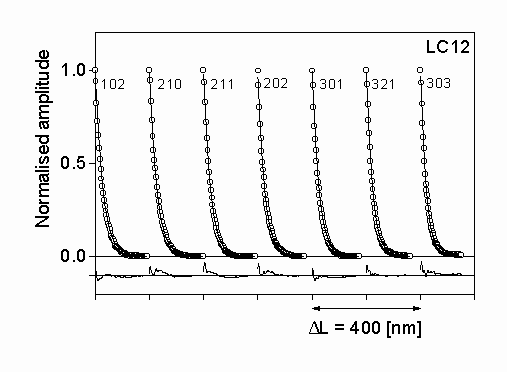
Figure 2: The measured (open circles) and the fitted theoretical (solid line) Fourier coefficients for silicon nitride LC12. The differences between the measured and fitted values are also shown in the lower part of the figure with the same scaling. The indices of the reflections are also
indicated.
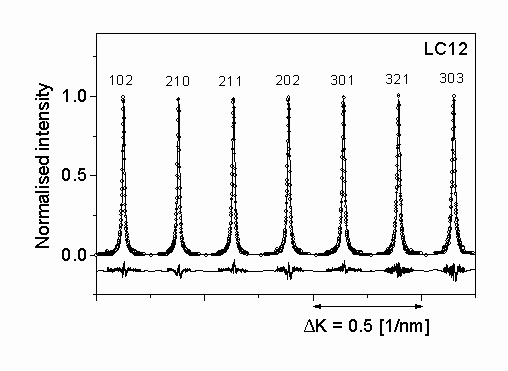
Figure 3.: The measured intensity profiles (open circles) and the inverse Fourier transform of the fitted Fourier coefficients (solid lines) for silicon nitride LC12. The differences between the measured and fitted intensity values are also shown in the lower part of the plot with the same scaling.
The diffraction profiles of seven selected peaks of a
-Si3N4 were measured by a high resolution diffractometer with negligible instrumental broadening. The measured profiles are Fourier transformed and fitted by the procedure described in section 3. The Fourier coefficients of the measured profiles for LC12 sample and the fitted ab initio functions normalized to unity are shown in Fig. 2. The differences between the measured and the fitted profiles are also presented in the figure. There is a good agreement between the two sets of data. In order to check the quality of fitting, the measured profiles are compared to the inverse Fourier transform of the fitted Fourier coefficients for the specimen LC12 in Fig. 3. The differences are also shown in Fig. 3. A very good correlation between the two sets of profiles can be observed. The agreement between the measured and the fitted data for SN1500 silicon nitride powder was also very good. The median and the variance of the crystallite size distribution, the area-, and the volume-weighted mean crystallite sizes and the dislocation density for the two samples obtained from X-ray peak profile analysis are presented in Table 1. The crystallite size distribution functions are plotted in Fig. 4. It can be seen that both specimens are nanocrystalline materials. The silicon nitride powder produced by nitridation of silicon and milling contains crystallites with lower mean size (median) and wider size distribution (variance) than the sample synthesized in thermal plasma. The dislocation densities in the two samples are in the same order of magnitude of 1014-1015 m-2, however, the value of r
is a bit higher in the ball milled specimen.
Table 1: The median, m, and the variance, s
, of the crystallite size distribution functions, the area-,<
x>
area, and the volume -,<
x>
vol, weighted mean crystallite sizes and the dislocation density, r
, obtained from X-ray peak profile analysis and the area-weighted mean particle size (t) determined from the specific surface area.
|
sample |
m [nm] |
s
|
<
x>
area [nm] |
<
x>
vol [nm] |
r
[1014 m-2] |
t [nm] |
|
SN1500 |
42±
3 |
0.55±
0.05 |
89±
7 |
121±
9 |
5.5±
0.7 |
94±
3 |
|
LC12 |
20±
3 |
0.65±
0.05 |
58±
5 |
88±
8 |
7.5±
0.8 |
71±
3 |
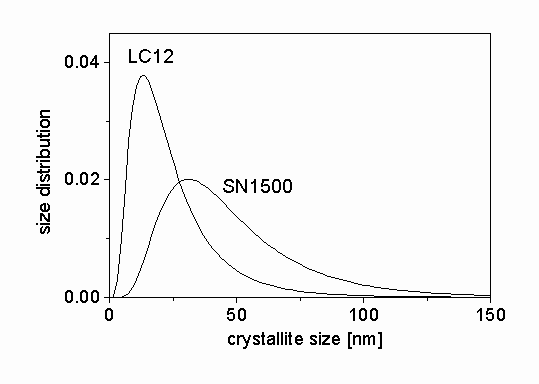
Figure 4: The size distribution functions determined by X-rays for the silicon nitride ceramic powders.
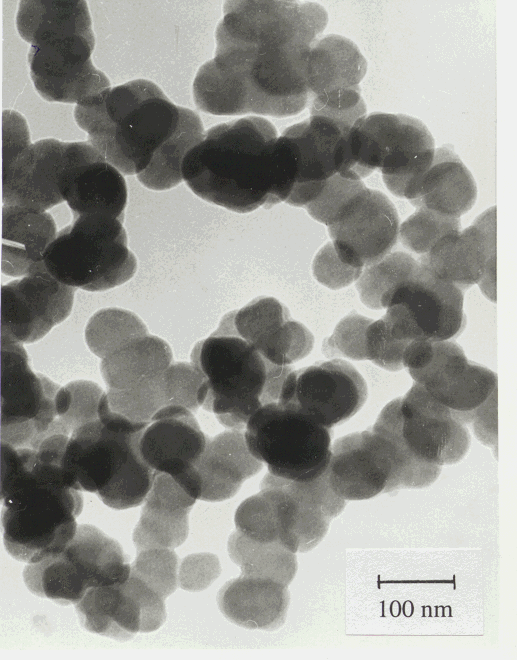
Figure 5: TEM micrograph of the silicon nitride ceramic powder LC12.
Table 1 also contains the area-weighted mean particle size (t) determined from the specific surface area of the powders. As it can be seen these values are in very good agreement with the area-weigthed mean crystallite sizes obtained from X-rays. A typical TEM micrograph of LC12 powder is shown in Fig. 5. The mean crystallite sizes obtained from X-rays are in good correlation with the particle size observed in the TEM micrograph. It should be noted that the volume of the powder illuminated by X-rays is at least five orders of magnitude larger than that in the TEM micrograph. From the above observations we can conclude that i) the particles in the powders are single crystals, i.e. for these powders the phrases crystallite and particle can be used in the same sense and ii) the X-ray procedure described in section 3 yields the crystallite (particle) size in good agreement with direct observations.
5. Conclusions
1. It has been found that the silicon nitride powder produced by silicon nitridation and post-milling had lower mean crystallite size and wider size distribution than the sample obtained by the crystallization of an amorphous thermal plasma synthesized silicon nitride powder.
2. It has been established that the mean crystallite size determined by X-ray line profile analysis agreed well with that obtained by direct TEM measurements or with that calculated from specific surface area for both silicon nitride powders.
3. The dislocation densities in the two samples are found to be in the same order of magnitude of 1014-1015 m-2, however the value of the dislocation density is a bit higher in the ball milled specimen.
Acknowledgements
The authors are indebted to Dr. Katalin Tasnády for the TEM micrograph. The authors are grateful for the financial support of the Hungarian Scientific Research Fund, OTKA, Grant Nos. T031786, T029701 and D29339.
References
- G. Ziegler, J. Heinrich and G. Wötting, J. Mat. Sci. 22 (1987) 3041.
- G. Petzow and R. Sersale, Pure and Applied Chemistry 59 (1987) 1674.
- J. Szépvölgyi and I. Mohai, in: G. N. Babini et al. (Eds.), Engineering Ceramics’96:
Higher Reliability through Processing, Kluwer Academic Publishers, Dordrecht, The Netherlands, 1997, p. 89
- F. Cambier, A. Leriche, E. Gilbart, R. J. Brook and F. L. Riley, in: R. Freer (Ed.), The
Physics and Chemistry of Carbides, Nitrides and Borides, Kluwer Academic Publishers, Dordrecht, The Netherlands, 1990, p. 13
- G. K. Williamson and W. H. Hall, Acta Metall. 1 (1953) 22.
- B. E. Warren and B. L. Averbach, J. Appl. Phys. 21 (1950) 595.
- B. E. Warren, Progr. Metal Phys. 8 (1959) 147.
- J. I. Langford, D. Louer and P. Scardi, J. Appl. Cryst. 33 (2000) 964.
- C. E. Krill and R. Birringer, Phil. Mag. A 77 (1998) 621.
- M. Rand, J. I. Langford and J. S. Abell, Phil. Mag. B 68 (1993) 17.
- A. J. C. Wilson, X-ray Optics, Methuen, London. (1962).
- J. Gubicza, J. Szépvölgyi, I. Mohai, L. Zsoldos and T. Ungár, Mat. Sci. Eng. A 280
(2000) 263.
- Ch. D. Terwilliger and Y. M. Chiang, Acta Met. Mater. 43 (1995) 319.
- W. C. Hinds, Aerosol Technology: Properties, Behavior and Measurement of Airbone
Particles , Wiley, New York. (1982).
- G. Caglioti, A. Paoletti and F. P. Ricci, Nucl. Instrum. 3 (1958) 223.
- P. Suortti, in The Rietveld Method, edited by R. A. Young, IUCr Monographs on
Crystallography, Vol. 5., Oxford University Press, p. 167. (1993).
- A. Le Bail, Proc. Accuracy in Powder Diffraction II, NIST Special Publication, 846
(1992) 142.
- M. A. Krivoglaz, Theory of X-ray and Thermal Neutron Scattering by Real Crystals,
Plenum Press, N. Y. (1996) and X-ray and Neutron Diffraction in Nonideal Crystals,
Springer-Verlag, Berlin Heidelberg New York. (1969).
- M. Wilkens, phys. stat. sol. (a) 2 (1970) 359.
- M. Wilkens, Fundamental Aspects of Dislocation Theory, ed. J. A. Simmons, R. de it,
R. Bullough, Vol. II. Nat. Bur. Stand. (US) Spec. Publ. No. 317, Washington, DC.
USA, p. 1195 (1970).
- P. Klimanek and Jr R. Kuzel, J. Appl. Cryst. 21 (1988) 59.
- T. Ungár and A. Borbély, Appl. Phys. Lett. 69 (1996) 3173.
- P. Scardi and M. Leoni, J. Appl. Cryst. 32 (1999) 671.
- T. Ungár, A. Borbély, G. R. Goren-Muginstein, S. Berger and A. R. Rosen,
Nanostructured Materials, 11 (1999) 103.
- J. Gubicza, J. Szépvölgyi, I. Mohai, G. Ribárik and T. Ungár, J. Mat. Sci., 35 (2000)
3711.
- T. Ungár, J. Gubicza, G. Ribárik and A. Borbély, J. Appl. Cryst. (2001) in the press.
- G. Ribárik, T. Ungár, J. Gubicza, J. Appl. Cryst. (2001) submitted.
- J. Szépvölgyi and I. Mohai, J. Mater. Chem. 5 (1995) 1227.
- J. Szépvölgyi, F. L. Riley, I. Mohai, I. Bertoti and E. Gilbart, J. Mater. Chem. 6 (1996)
1175.
- C. P. Gazzara and D. R. Messier, Ceram. Bull. 56 (1977) 777.
- N. Camuscu, D. P. Thompson and H. Mandal, J. European Ceram. Soc. 17 (1997) 599.
- M. Wilkens and H. Eckert, Z. Naturforschung, 19a (1964) 459.
- B. C. Lippenca and M. A. Hermanns, Powd. Met. 7 (1961) 66.
- R. Kuzel and P. Klimanek, J. Appl. Cryst. 21, (1988), p.363.
- T. Ungár, I. Dragomir, Á. Révész and A. Borbély, J. Appl. Cryst. 32, (1999), p.992.
- T. Ungár and G. Tichy, phys. stat. sol. (a) 171, (1999), p.425.
- Ch.-M. Wang, X. Pan, M. Ruhle, F. L. Riley and M. Mitomo, J. Mater. Sci. 31 (1996)
281.
- K. Rajan and P. Sajgalik, J. Am. Ceram. Soc. 17 (1997) 1093.
|

