 |
|
Kezdőlap-Home
Page |
||||||||||||||||||||||||||||||||||||||||||||||||||||||||||||||||||||||||||||||||||||||||||||||||||||
|
II. évfolyam 3. szám 2001. július [HUN] - Magyar cikk
|
On the computer software for the LD converter process at the Dunaferr Works M.Z.Benkő
LIMOS R&D Group, Department of Quality Control
The LD-converter process is a very complex technology, in which the liquid pig iron with some steel scrap additions is ‘blown’ by high speed oxygen gas. The basic goal of the process is to ‘blow out carbon’ from the pig iron, i.e. to convert the majority of the carbon-content of pig iron into volatile CO. As during the LD-converter process and the continuous casting of steel there is no more chance to influence the temperature of the liquid steel at Dunaferr Works, the secondary goal of the LD-converter blowing is to heat up the steel at desired temperature due to exothermic reactions. In order to achieve these two goals at the same time – the desired carbon content of the steel (average of 0.045 %) and the desired temperature of steel (average of 1,670 oC) – the steelmaker has two major parameters what he or She should select accordingly: this is the composition of the charge (quantity of the liquid pig iron of given quality and temperature + quantity of the steel scrap of given (?) composition) and the amount of oxygen to be blown into the system. There are also other, secondary parameters, such as the amount of lime and CaF2 (calcium fluoride), and the algorithm of moving the lance during the blowing process. However, the later is usually performed in a reproducible way, while the formers are usually calculated as function of the composition of the charge. It should be mentioned, that there is no “sub-lance” installed at Dunaferr Works, i.e. the blowing process should be stopped ‘blind’, without any straight information on the state of the system, and in this way the desired temperature and carbon content should be ‘hit’ also ‘blind’ by the steelmaker. If the situation is ideal, the steelmaker is usually able to reach the desired carbon content and temperature. The situation is ideal from the point of view of the steelmaker, if:
It should be clear to anyone who has been any close to a steelmaking process that the fulfilment of the above conditions is rather a wish than a reality. In real world, the steelmaker has to make decisions, while 10-50 parameters change in the same time. In time of computers this task should preferably be performed by computers. The goal of the present paper is to give a short summary of the software. The software is written based on a model developed by us using all available information on the process in the literature [1-7]. The model is described in details in [8-12]. For modelling [13-14] was used as an additional information. Our work during the last 2 years was performed in the following three stages:
This paper is written to describe the results achieved in the last phase of the development. In addition to describe the software, some rules of thumbs will be generated by the software, which can be used by the steelmakers even if they do not use the present software. The author, of-course, would prefer that steelmaker consult this software on-line during their work.
2. Summary of the physico-chemical model The ever-developing versions of our model [8-12] were constantly tested by 80 measured data of altogether 4,000 charges produced at Dunaferr Works in 1999 and in 2000. The model basically consists of two parts: the material and the heat balance. The material balance is basically done for the final carbon-content of the steel, while the heat balance is basically done for the final temperature of the steel. Although the aim of the material and heat balances are limited, the full material and heat balance of the process should be designed. The principles of constructing material and heat balances are described in any textbook on metallurgical or chemical engineering, with different simplified examples. However, to make a real material and a heat balance for a working, high-temperature, opened device with a 150 t charge (such as an LD converter) is always full of surprises and challenges. We believe that during our 2-year project we have identified and approximately solved the most significant problems of static modelling of the LD-converter process, with a specifically selected semi-empirical parameters, being valid for the devices working at Dunaferr Works in 1999-2000. There are basically four phases involved in the converter steel-making: the liquid metal (including the dissolved and melted steel scrap), the molten slag (including all non-metallic additions and a part of eroded-dissolved lining), the gas and the converter apparatus (being a multi-phase construction, itself). The effect of penetration of slag and metal into the lining is neglected in the material balance. From the industrial data it has been estimated that only about 4 kg of lining dissolves in the slag of each charge. Thus, our material balance is based on the consideration of only three phases: the liquid metal, the molten slag and the gas phase. During the process different components are distributed between these three phases. The goal of the material balance is to identify the amounts of all components appearing in these three phases. Primarily the results of this calculation will be used to control if the desired steel composition (basically the carbon-content) has been achieved. Secondarily, the result of the material balance will be used to calculate different terms of the heat balance. During the process about 80 parameters are measured for each charge. From the point of view of the model development and the software to be written for the static control of the process, the data should be grouped according the moment of their availability. Before starting the process the following data are available:
During the process the exact quantity of the lime and CaF2 added is measured. These quantities should be defined by the steelmaker or by the software, and are usually calculated based on the amounts and composition of pig iron and scrap. After the process the following additional data are obtained:
The later data have been known during the model development for 4,000 charges, but should be calculated by the software during the real static control of the process. The quality of the software is actually characterised by the deviation between the previously calculated and the measured later data. At the stage of model development all the above data were taken from the data-bank of the 4,000 industrial charges. Unfortunately there are certain data, requested for the material balance, but not measured during the process. These data were estimated by us as follows:
From the ‘full’ characterisation of the 4,000 produced charges at Dunaferr Works listed above, the materials balance for non-volatile components can be composed (Si, Mn, Ca, Mg, P, Al). To our great surprise, significant and reproducible dis-balances were found for Si, Mn, Ca, Mg and Al. Moreover, correlations have been established between the dis-balances of Si, Mn and Ca for different charges. These observations could be explained only, if one supposes that some additional materials appear in the charge, in addition to those, realised by the steelmaker today. This additional material is much probably non-metallic, having higher SiO2, Al2O3 and MgO-content, and lower CaO and MnO-content compared to the steel slag. There are basically two possible sources of such an additional material:
In addition to the above discussed two un-realised sources for the materials balance, there is always some un-dis-charge amount of steel slag, remaining in the converter from the previous charge, and dissolving in the new slag. Although its composition is known from the analysis of the previous charge, its amount is not known either. From the detailed analyses of the dis-balances of Si, Al, Mg, Ca and Mn the average amounts of the three new phases have been estimated as described below. Finally, the material balance during the model development was calculated as: The amounts of oxidised components miox, kg (i = C, Si, Mn, P, Al):
where mpiron, mscrap is the mass of liquid pig iron and steel scrap (t), as measured, i.e. without taking into account the amount of the pig iron slag mpironslag (t) and the scrap dirt mscrapdirt (t), Cij – the weight% of component i in phase j, msteel (t) is the final amount of steel, calculated as:
where LO º COsteel/CFeOslag – the distribution coefficient of oxygen between the steel and the slag, CFeOslag is actually the total weight% of FeO and Fe2O3, reported usually together in the slag chemical analysis, 0.95 t – is the amount of Fe lost during the process with the gas stream. The amount of slag mslag (t) can be calculated as:
mprevslag (t) – the amount of remained slag from the previous charge, mnonmet – the total mass of all non-metallic additions (minus their CO2 and H2O content) charged into the converter, such as lime, etc., including 4 kg per charge of the lining of the converter, ki – the ratio of molecular mass of the oxide of component i to the atomic mass of component i. If the values miox for i = C, Si, Mn, P, Al and msteel and mscrap are calculated from Eq-s (1-3), the material balance for the non-volatile components (Si, Mn, Ca, Mg, Al) can be written as:
where the summation by j is performed for ‘pironslag’, ‘scrapdirt’, ‘prevslag’ and ‘nonmet’, Ci,oxj – is the oxidised form of component i in the phase j. Equations (4) for all the 5 components Si, Mn, Ca, Mg, Al can not be all satisfied with only three free variables mpironslag, mscrapdirt and mprevslag. However, the combination of these three parameters can be optimised for each charge in a way that the minimal value of the total dis-balance of the 5 components Si, Mn, Ca, Mg and Al is obtained. As a result of performing this optimisation procedure for 4,000 charges, the average values were found. During applying our software these values will be used as pre-set parameters. However, the steelmaker will have the option to change those parameters, as they have a serious influence on the reliability of the software (see the example below). Now, the oxygen balance can be written, from the assumption that the average O2-content of the oxygen gas is 98.5 %, and no O2 escapes to the gas phase from the oxygen blown into the converter. The oxygen balance is written in m3, corresponding to 20 oC and 1 bar:
where VOX is the amount of oxygen gas blown into the converter, vi – are coefficients connecting the oxidised amounts (kg) and the m3: vC = 1.0144, vSi = 0.8677, vMn = 0.2218, vP = 0.9835, vFe2 = 0.2182, vFe3 = 0.3273, vAl = 0.6021, e - the ratio of CO oxidised to CO2 in the gas stream, 280 m3 – corresponds to the 950 kg of iron lost, the last term corresponds to the oxygen dissolved in steel. From Eq.(5) the value of e could be found for each charge. Its average value is 0.22 ± 0.06. This value is in the reasonable interval, as it is indeed between the value 0.1 and 0.3 found experimentally in [6], and is close to the average value of 0.18 used in the previous material balance [5] designed for the LD process at the Dunaferr Works. Based on the material balance, the heat balance was constructed. It should be mentioned, that while the material balance is constructed on a purely thermodynamic basis, the heat balance should also involve kinetics, as the heat losses will be time-dependent. One cycle of the converter can be envisioned as follows. The converter is kept empty (actually, with a remained steel slag from a previous charge) for a certain period, while it naturally cools down. Then, the (cold) steel scrap is added into it. Later, the liquid pig iron is poured into converter. Its temperature has been measured previously with the certain time shift. The blowing process starts at a given moment of time and lasts for a certain period (about 20 minutes) with a constant rate of 400 m3O2/min. During blowing some lime and CaF2 (and sometimes other additives) are added. From the point of view of the heat balance, the converter with a certain initial heat content + steel scrap, lime, and oxygen gas of the outside temperature + liquid pig iron of the measured initial temperature results into the final state of the steel, slag, gas and converter of a given final temperature/heat content. During the process the temperature increases due to exothermic oxidation reactions and due to the exothermic reactions of complex formation in the slag, while this heat is consumed for the heating of all the phases (including their melting) and for the heat loss to the environment. Thus, the heat balance can be written as:
The sign of the above terms are chosen according to thermodynamics: heat-evolving processes (QOX and QSLAG) are taken with a negative sign, while heat –consuming processes (QHEATING, QLOSS ) are taken with a positive sign. At the given mass balance Eq.(6) is satisfied only at one given final temperature Tfin, if all the 4 terms are described as function of Tfin. During the model development the goal was to create such a model with reasonable semi-empirical parameters, which is able to reproduce the measured Tfin values, while during the static control procedure the aim is to predict the value of Tfin for a given details of the material balance and other initial parameters (time intervals, initial temperatures). The heat evolved during the oxidation and consumed due to melting and heating was calculated using standard thermodynamic procedures [13]. The heat due to complex formation was estimated by the associated model for the slag [15-16]. It is worth to mention, that a new method has been developed by us, by which the ratio of the exothermic heat of the gas-reaction CO + ½ O2 = CO2, used for heating the charge could be determined [11] (the balance of this heat is lost to the environment). After three terms of Eq.(6) were found, the fourth term, i.e. the heat loss can be found for each charge as a balance of Eq.(6). This is the standard procedure how the heat loss term is treated in the literature. To the contrast to that, we have created the detailed thermal model of the LD-process, and calculated the heat loss with a set of 10 equations, taking into account different sources of the heat loss [9]. These detailed equations allow us to take into account the effects of different holding times between the consecutive charges, and other deviations from the average time schedule of the process. Our equations also allow to take into account the prolonged effects of long holding times. We are also able to calculate the heat balance during the first 100 charges, while the converter is heated up from the room temperature. Our equations also allow to take into account the effect of the preparation of the converter lining performed between the charges. Finally, our detailed material and heat balance allowed to reproduce with a reasonable accuracy the empirical (measured) data during the 4,000 industrial charges. Based on that, the algorithm of the static control was created [9], and the software to be presented in this paper was written.
The goal of the software is multi-functional. It has the following moduls:
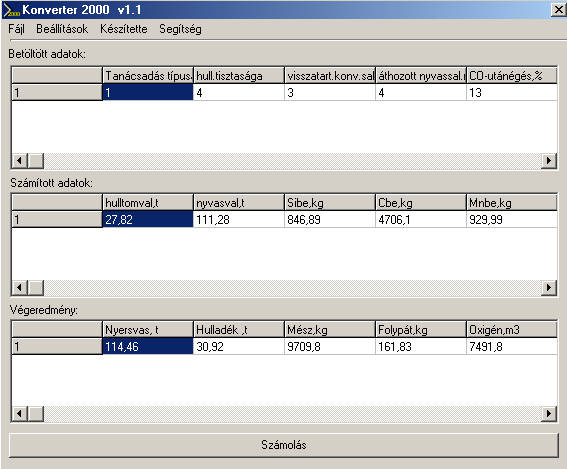
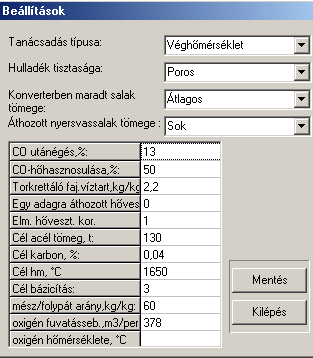
The main communication panel of the software can be seen in Fig. 1. In Fig.2 one of the sub-communication panels is shown, on which the steelmaker can alter the basic semi-empirical parameters of the software. This is usually taking place after running the test-module of the software.
Fig.1. The main communication panel of the software Upper row: Initial Data: Modul type, Level of dirt of the steel scrap, level of slag remained in the converter,level of pig-ron-slag, brought into the converter, post-burn of CO, (%), etc.. Middle row: Calculated Data: Real scrap mass (t), Real pig iron mass (t), Si in (kg), C in (kg), Mn in (kg), .etc Bottom row: Final result (charge): mass of pig iron (t), mass of steel scrap (t), mass of lime (kg), mass of CaF2 (kg), Oxygen (m3)
All calculated results can be observed during the process. The final result calculated by the software is different for the four modules. The results of the ‘charge-modul’: mass of pig iron (t), mass of steel scrap (t) mass of lime (kg), mass of CaF2 (kg), mass of CaF2 (kg), volume of O2 (m3), FeO-content of slag (%). The results of the oxygen(C)-modul: volume of O2 (m3), blowing time (min:s), final temperature (oC), FeO-content of slag (%). The results of the oxygen(T)-modul: volume of O2 (m3), blowing time (min:s), final C-content of the steel (%), FeO-content of slag (%). The results of the test-modul: final C-content of steel (%), final temperature (oC), FeO-content of slag (%), and the deviation of the above from measured values, with the advice to alter semiempirical data given in Panel 2 (see Fig.2).
Fig.2. One of the sub-communication panels to alter semi-empirical data from top to bottom (in brackets the values set): Modul type (Oxygen(T)-modul), Steel scrap quality (dry and dirty), Mass of slag remained in the converter (average), pig-iron slag carried over to the converter (a lot), CO-over-burn (13 %), efficiency of CO-overburn exothermic heat (50 %), specific water content of the material used to repair the lining during charges (2.2 kg/kg MgO), Long-term heat loss from the previous charge (0 GJ), Correction to our theoretical heat loss (1), the target steel mass (130 t), target C-content of steel (0.04 %), target final temperature (1650 oC), target basicity of the final slag (3), ratio of lime to CaF2 (60 kg/kg), oxygen blowing rate (378 m3/min), initial oxygen temperature (0 oC). 4. Examples on the application of the softwareIn the present chapter some examples of possible applications of our software will be presented, both in industrial practice and in training/education.
4.1 Application of the software during production Let us study one of the charges produced by Dunaferr in 2000. The target parameters were 1660 oC and 0.05 % of C-content. This was a ’regular’ charge, without special events before and during its production. The plant data of this ctage are shown in the first row if Table 1. One can see, that the temperature was ’over-shot’ by 9 oC, while the C-content was ’over-shot’ by 0.002 %. First, we run the software in the Oxygen(T)-modul (fixing the target temperature at the measured value), to check if the plant-data are reproduced by our calculations. As one can see from row 2 of Table 1, the carbon content calculated by us is much higher than its actual value (and the FeO-content of slag is much lower than the actual value), if an ‘average’ amount of the pig-iron slag carried into the converter is supposed. However, if this amount is change to ‘a lot’ (see Panel 2 in Fig.2), the calculated and actual C-content of the steel and FeO-content of the slag become practically identical (see row 3 in Table 1). Physically the amount ‘a lot’ for the pig-iron slag is confirmed by the charge-report, saying that the slag from the top of pig iron was NOT removed in this charge (i.e. ‘a lot’ could be there). Hence, the importance to select correct values on Panel 2 is obvious from this example. If the Oxygen(T)-modul is run for the same charge, but by setting as target temperature the real target temperature of 1,660 oC, one can see (row 4 of Table 1) that although (of-course) this temperature can be achieved, it is accompanied by a too high C-content of the final steel. This is due to the not-optimised charge composition. Therefore, first the Charge-modul was run, suggesting data, given in Table 2. In Table 2 also the charge composition of the industrial charge is given, for comparison. Then, using the charge-composition suggested in Table 2, the Oxygen(T)-modul was run, again. As one can see from the last row of Table 1, the target temperature and carbon-content can be achieved almost perfectly, using our software. Hence, our software has a real value for industrial application. Table 1. Plant data (1st raw) and calculated data (rows 2-5) for a charge produced at Dunaferr
*measured data **fixed data during calculation Table 2. Charge composition for the charge given in Table 1.
4.2 Application of the software during education/training In addition to its primary goal (to be used by the steelmaker during the process) the test-module of the software is worth to be used also outside the plant, during education and training. Let us give some examples. Fist, let us consider an average charge with average parameters. Then, let us change step-by-step one of the parameters of the process. In this way the primary influence of each parameter can be studied on the final temperature of the process. The results are given in Table 3.
Table 3. The primary influence of different parameters on the final tempearure of steel
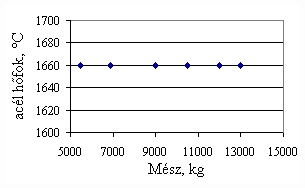
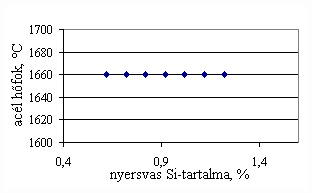
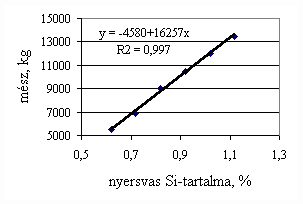
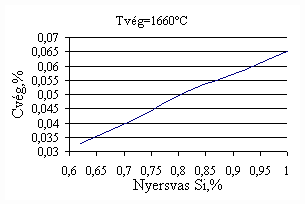
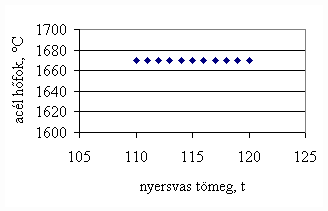
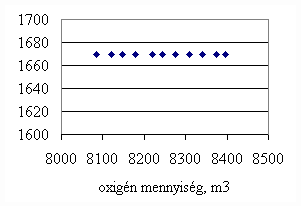
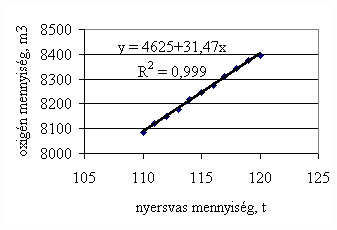
*starting from the new lining of the converter ** between the moment when its temperature is measured and the moment of its pouring into the converter The primary influences of different parameters are ’known’ by the steelmakers, as well, from their empirical practive. In majority of cases the values given in Table 3 were confirmed by the steelmakers. In real steelmaking practice, of course more than one parameter changes at the same time. However, as the number of independent parameters is at least 15 (see Table 3), altogether 15 ! = 1.3 1012 combinations exist, what is obviously much more than is possible to describe in the framework of this paper, or what can be learned and remembered by a human being, even if he or She is a STEELMAKER. That is why we suggest to use or software in practice. Just to illustrate what else can be done by the test-modul of the software, let us show some two-parameter cases, in a compensation-regime. Let us first consider the Si-content of the charge, changing gradually. Then, let us use our software to calculate the amount of lime, needed to compensate the effect of Si on the final temperature of steel. The results are shown in Fig.3. One can see, that with an increasing amount of lime the increasing Si-content of the pig iron can be compensated. From Fig.3.c one can see that the slope of the curve is 16.257 kg/%. From the primary parameters given in Table 1, the expected value is 210/0.009 = 23,300. The difference is due to the fact, that processes in the difficult system are not simply additive. However, it should be reminded, that compensating the final temperature is not the total goal. In Fig.3.d the change of the C-content of the final steel is presented, as function of Si-content of the pig-iron, if its influence in terms of temperature is compensated by lime, according to Fig.3.c. One can see, that the compensation method can be used only within a limited range, as the C-content of steel can become un-acceptably high. If the Si-content of the pig iron is changed too much, instead of the simple lime-compensation the whole charge-composition should be re-calculated using our Charge-Modul to obtain steel with both target C-content and temperature. From Fig-s 3 one can see, that if the C-content is to be kept in the range between 0.0475 and 0.0525 %, for the given other parameters the Si-content of pig iron should be in the interval 0.784 – 0.842 %. Only in this case the lime-compensation method is accepatble. In our second two-parameter example, the increasing amount of the pig iron is compensated by the amount of oxygen, in order to keep the temperature constant. As can be seen from Fig.4.c, the practical slope is 31.5 m3/t, while the ‘additive’ slope from Table 3 is 3.7/0.12 = 30.8 m3/t. Figures 4 can be used with the same limitations as Fig-s 3, i.e. if the change is large, the scrap-amount should be changed, as well. a.
b
c.
d.
Fig.3. Compensation of the increasing Si-content of pig iron with the amount of added lime to keep constant temperature. (a.: temperature as function of Si-content of pig iron, b.: temperature as function of amount of lime, c.: amount of lime as function of Si-content of pig iron, d.: C-content of steel under conditions 3.a-c, as function of Si-content of pig iron).
a.
b.
c.
Fig.4. Compensation of the increasing mass of pig iron with the amount of oxygen added to keep constant temperature. (a.: temperature as function of mass of pig iron, b.: temperature as function of amount of oxygen, c.: amount of oxygen as function of mass of pig iron)
Conclusions The software for the static control of the LD steelmaking process has been presented, based on a detailed physico-chemical model. The software is able to calculate the optimum charge composition and the amount of oxygen to be used to achieve target temperature and C-content of steel, during blow. The software can be used also in training, as it can simulate the LD-process. The influence of different parameters on the steel temperature has been obtained in this paper. Our data are confirmed by empirical thumb rules used in the plant. However, when several parameters are changed at the same time, the thumb rules fail, as the process is not linear. In this case the software should be used to achieve optimum parameters.
References
G.Csabalik, Steelmaking III. (in Hungaruiuan), Tankönyvkiadó, Bp.1984 Handbook on Metallurgy of Iron (in Hungarian), ed. by A.Óvári, Műszaki Könyvkiadó, 1985 E.T.Turkdogan, Fundamentals of Steelmaking,The Institute of Materials, 1996 Z.Szabó, A.Szélig, Manuscript of an LD-modell (in Hungarian), Dunaferr,1993 G.Horváth et al, Manuscript on Neural advisory system of LD-steelmaking (in Hungarian), BME, 1997 J.Bak, Z.Polányi, A.Szélig, Manuscript on CO-emmission of the LD-furnace (in Hungarian) Dunaferr,1999 G.Kaptay, M.Z.Benkő, Five manuscripts on physico-chemical basis of LD steelmaking, suppo G.Kaptay, M.Z.Benkő, Two manuscripts on the Physico-chemical Model and algorithm of the software for the LD-steelmaking (in Hungarian), Miskolci Egyetem, Septem M.Z.Benkő, G.Kaptay: Description of the LD-software (in Hungarian), Miskolci Egyetem, March, 2001. M.Z.Benkő, G.Kaptay, BKL Kohászati Lapok, 133 (6-7) (2000) 241 M.Z.Benkő, G.Kaptay, in: “Proc. of microCAD2000”, University of Miskolc, 2000, 13-18. I.Barin, Thermochemical Data of Pure Substances. VCH, 1993 CRC Handbook of Chemistry and Physics, ed. by D.R.Lide, CRC Press, 1993-94 G.Kaptay, E. Bereczthe , Chemical Papers, 45 (1991) 145 B.Török, L.A.Tóth, G.Kaptay, in: “Proceedings of MICROCAD ’99, Section B: Metallurgy, Energetics”, University of Miskolc, 1999, pp.75-81.
|
|||||||||||||||||||||||||||||||||||||||||||||||||||||||||||||||||||||||||||||||||||||||||||||||||||||

 (2)
(2) (3)
(3)